Conscious Automaton
>>> from hristog.thoughts import random
Data Science Sports Analytics Python Linux About
Natural Language Processing Fantasy Football Analysis
Team-Play Contributions of the Top Forwards for the FPL Season 2016/2017
Fantasy Premier League Team Selection
This post is a part of my Fantasy Football team selection series, where - as alluded previously - I aim to assist you in the best possible way in making your 2017/2018 picks, at pre-season time, as well as once the season has been kicked off.
Last time our focus was on investigating how each player - among those ones who finished at the first 50 positions, ranked by highest overall points scored - contributed to the total points count of his team and, furthermore, his playing line within the team.
This post, however, is more concerned with the actual playing characteristics of the leading1 players, as observed in their overall statistics for the English Premier League 2016/2017 season.
Contribution to Team Play
Particularly, we'll look at various attacking and defensive statistics2 of top players from different lines. In order to keep the analyses clean and uncluttered, I've decided to split the visualisations and commentary on a playing line basis; thus, this post is, essentially, the first in a series, that will focus on individual contributions to team-play. We'll start by looking at the forwards, who have netted 150 points or more last season. They turn out to be 7 in total:
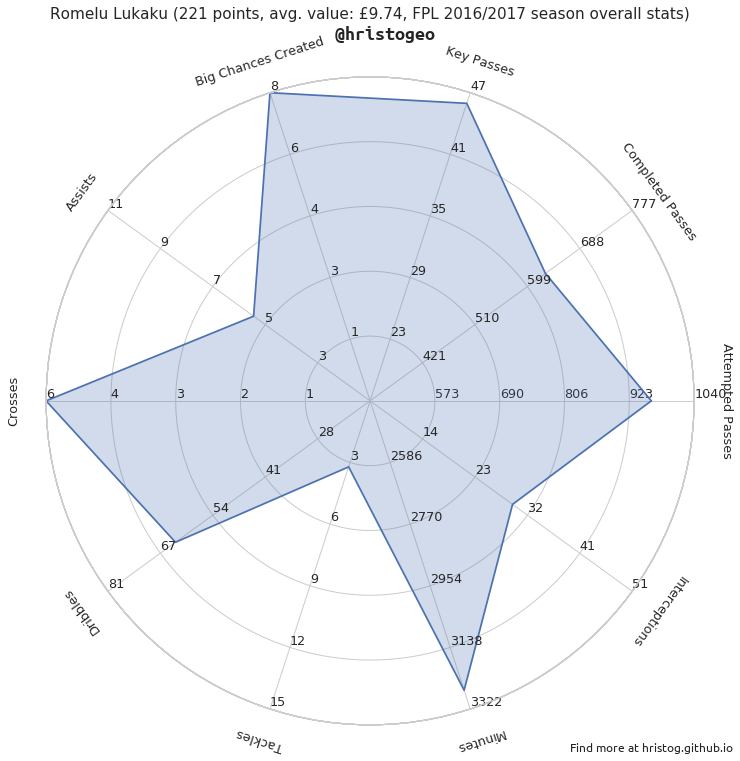
- Romelu Lukaku (221 points, avg. value £9.74)
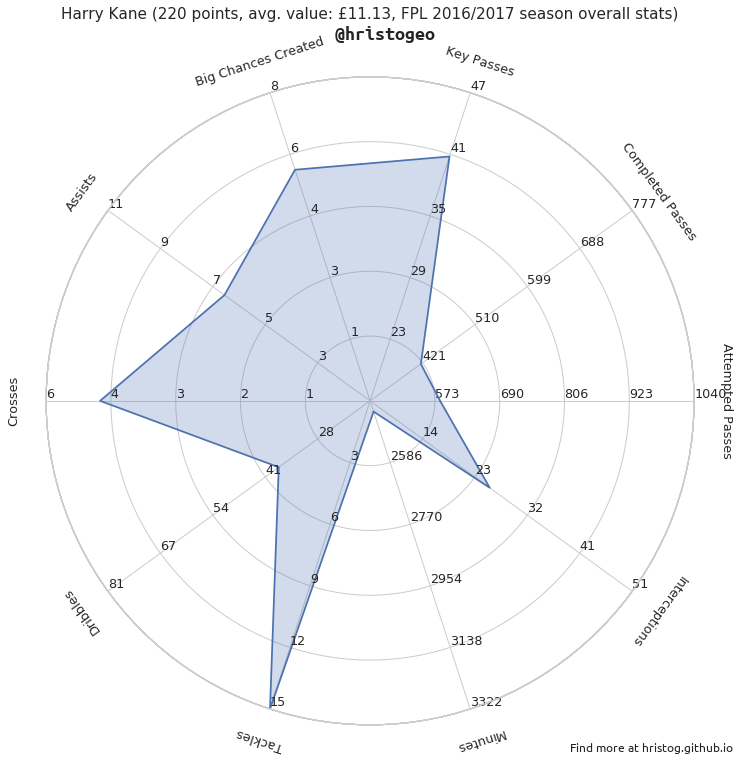
- Harry Kane (220 points, avg. value £11.13)
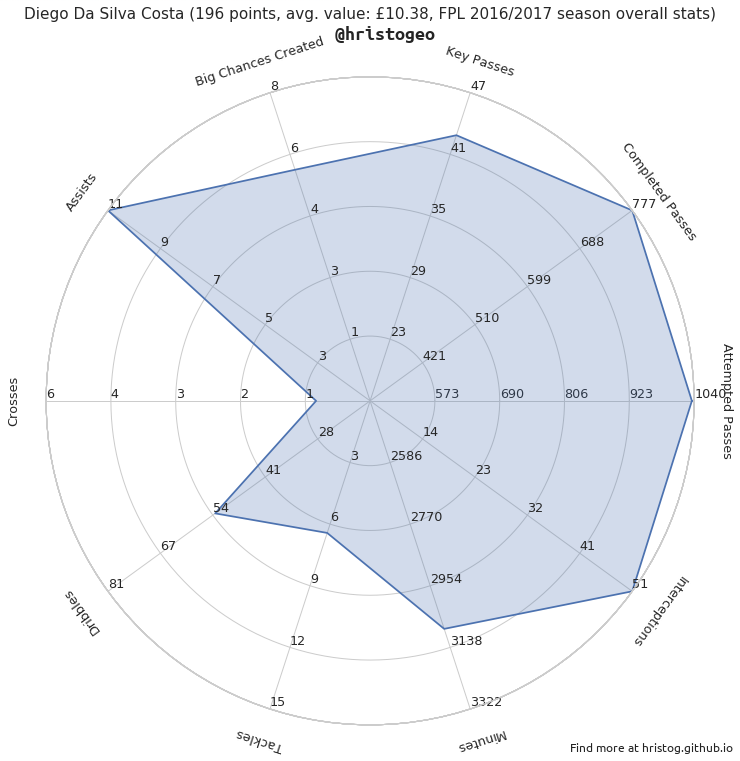
- Diego Da Silva Costa (196 points, avg. value £10.38)
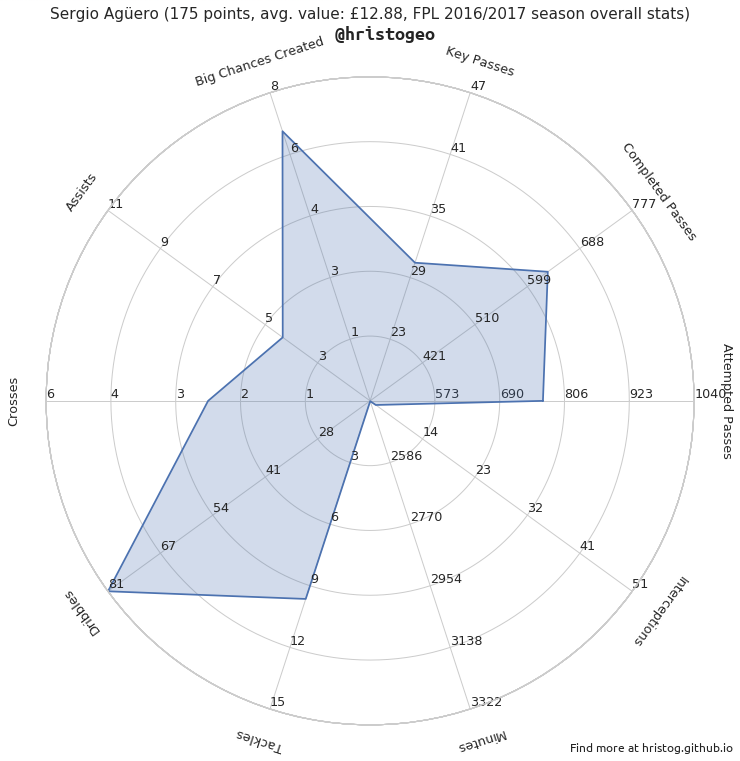
- Sergio Agüero (175 points, avg. value £12.88)
- Jermain Defoe (166 points, avg. value £7.54)
- Zlatan Ibrahimovic (163 points, avg. value £11.44)
- Jamie Vardy (161 points, avg. value £9.76)
Visualisations
Once again, as in the entire series, I've chosen to put forth, with utmost importance, self-explanatory plots, requiring the minimum amount of supplementary explanations that are only related to various technicalities, which cannot be explained solely by employing visual cues. Examples of such are characteristics of the given population sample, or of the scale axes etc.
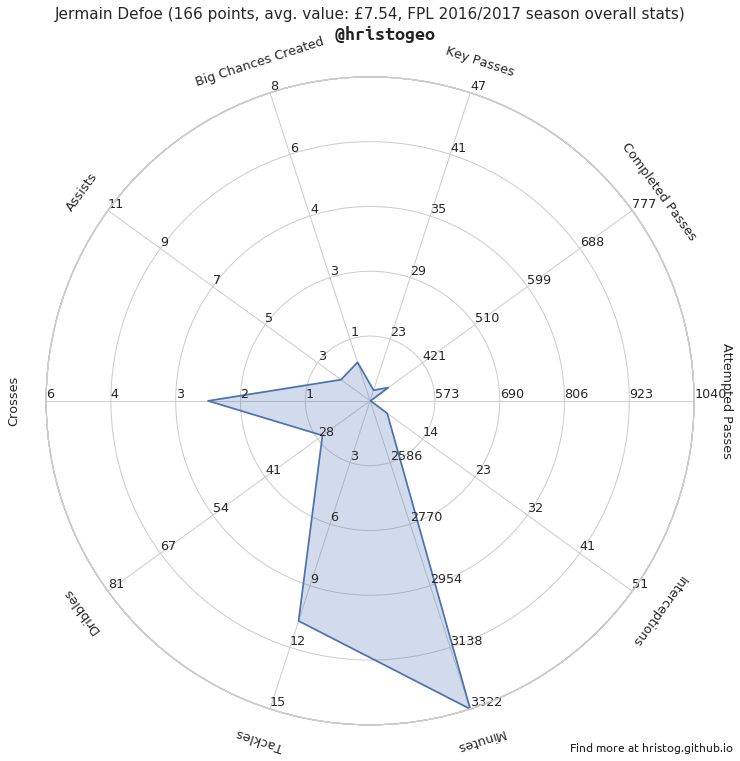
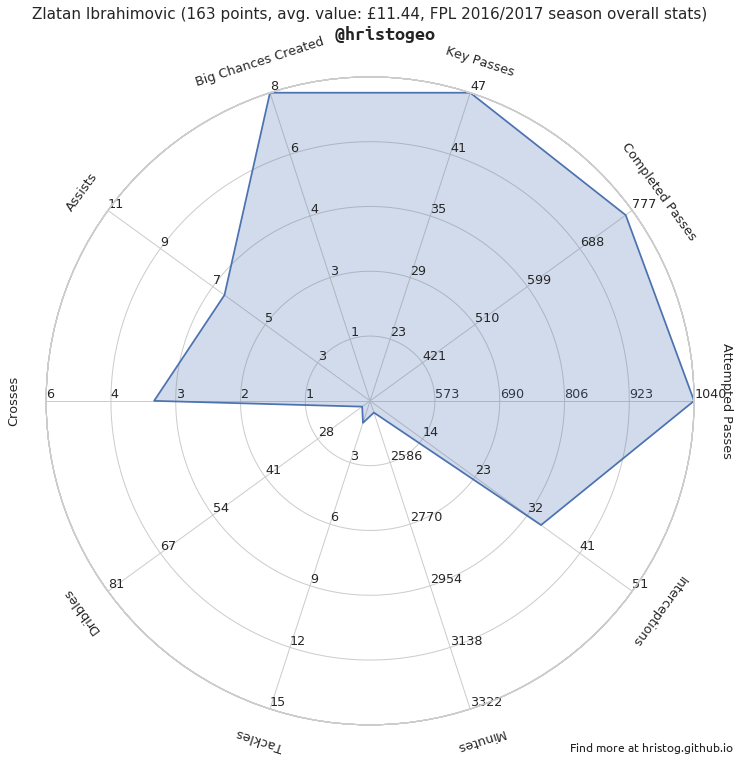
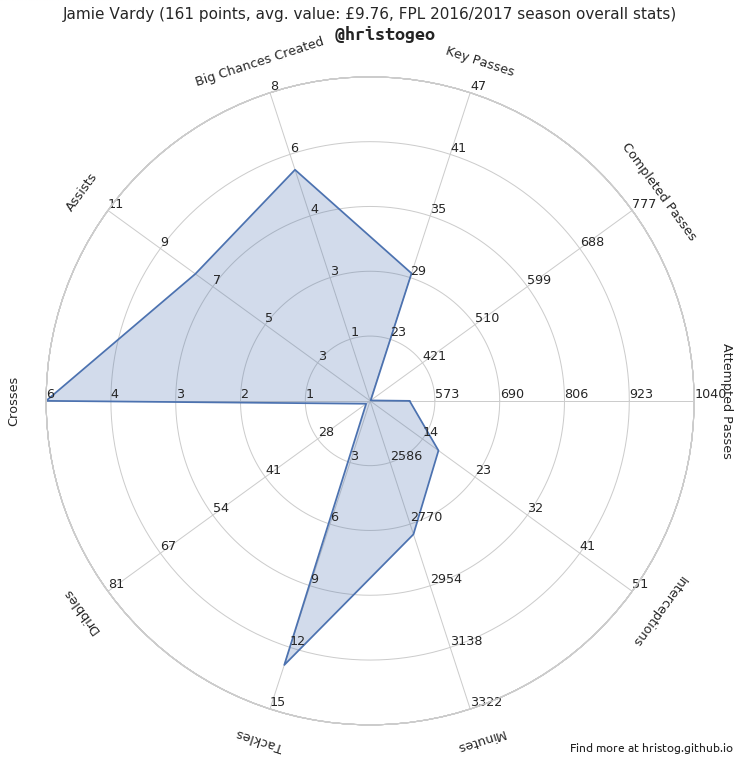
As enlisted above, the play contribution plots are captioned, naturally, with the player name, along with the total amount of points scored for the corresponding season, as well as the average transfer cost of that player (averaged over the cost of that player, corresponding to each individual gameweek). It is important to note here that the scale ranges/limits are fixed for all plots, for the purpose of enabling comparability between individual players. The maximum value along each scale is the greatest value that has been observed among only the seven forwards on focus (as the idea of the study is to find indicative characteristics, in a relative fashion).
I'll briefly go over some significant observations, based on the graphs presented above, whilst leaving the conclusions, as well as transfer and selection decisions, as an exercise, entirely for you. Firstly, we can see that the most creative forwards are Costa, Lukaku and Ibrahimovic, with Kane following somehow closely in pursuit. In defensive plan, noteworthy mentions are Kane, Costa and Defoe, along with Ibrahimovic.
As for the not so positive "contributions", some sort of an indication (or validation in Agüero's case) can be inferred, regarding a player's injury proneness or lower capabilities for recovery from fatigue. Namely, Kane's, Agüero's, Ibrahimovic's and Vardy's performances are characterised by the lowest number of minutes played. This, in Kane's case automatically grants him the award of highest conversion efficiency, as he's the top goalscorer of last season, and a runner-up in the total points ranking, for his playing line (losing by just a single point, to Romelu Lukaku, who played 831 minutes more than Kane did; this is 9.25 games!). This, essentially, reinforces the self-referential nature of this post by serving as a reminder that a player's output - in terms of goals, total points scored or otherwise - is largely a function of the collective contributions4 of those team-mates (whose output is also result of the same recursive process), who were part of the ten playing field players, at any given time, as well as the team synergy level.
At the other end of the spectrum, Jermaine Defoe, aged 34, spent the mind-bending 3322 playing minutes on the field, which when converted to number of games adds up to almost 37 games!
Conclusion
That's all for today, folks! Good luck in the forthcoming Fantasy Premier League season, and stay tuned for more analysis and visualisations on the same topic. It may be a good idea to follow me on Twitter, if you haven't done so already ;)
-
I maintain the opinion that the most useful analyses are those which invariably incorporate the notion of player output, as expressed in Fantasy Football terms, namely points scored (as this is the ultimate metric, based on which, all teams are ranked in the league standings, be it final or intermediate). Thus, it's always useful to reflect and, if possible, present a form of correlation analysis (or display) between the total points, possibly accompanied with its sister metric - player transfer value (or cost), and whatever discriminative features or statistics are utilised for analysing a subset of players. ↩
-
Please, note that I've deliberately excluded the total number of goals scored, which by itself can be a misleading statistic, as it doesn't clearly indicate whether the goals in question were scored predominantly as a result of a player's attacking positioning, his finishing skill, his teammates' creativity or otherwise. ↩
-
The interceptions metric has been particularly defined to include the total number of clearances, blocks and interceptions, for a given player. ↩
-
This can be further verified via referring to the study of total points contributions, which pays an honourable mention to the Tottenham midfield line, who were the highest scoring midfield line for FPL season 2016/2017, in terms of total number of points scored. ↩